Understanding China’s Property Market
China’s housing market is one of the most important parts of its economy—and also one of the most misunderstood.
Introduction & Summary
China’s housing market is one of the most important parts of its economy—and also one of the most misunderstood. This is important because residential real estate, together with construction, last year accounted directly for about 10% of GDP, 18% of fixed-asset investment, 10% of urban employment and more than 15% of bank loans.
It is also misunderstood because few observers appear to understand the structure of China’s residential market. This issue of Sinology explores:
- The recent development of China’s property market is one of the world’s greatest and least-recognized privatization success stories, taking the home ownership rate to 89%, compared to 66% in the U.S.
- New home sales are driven by owner-occupiers, not speculators.
- There are more than 150 Chinese cities with a population of at least 1 million (only nine U.S. cities and 50 metro areas are comparable in size), and these account for the vast majority of home sales.
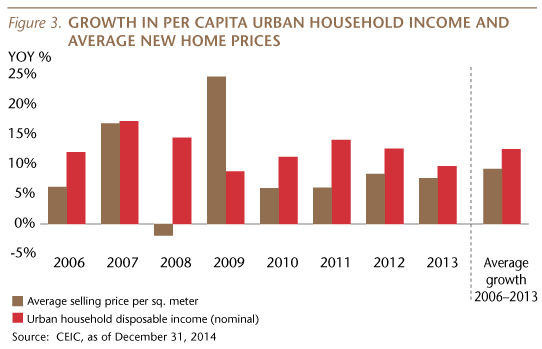
- New home prices rose at an average annual pace of 9% over the last eight years, but nominal urban income rose 13% per year.
- There is very low leverage among homeowners: about 15% have paid all cash and for those using a mortgage, the minimum down payment is 30%.
- Chinese banks have not been permitted to offer subprime mortgages. There are few asset-backed securities and almost no secondary securitization (such as collateralized debt obligations and collateralized loan obligations).
- There are some failed projects, but the “ghost city” story is greatly exaggerated. For residential projects three years post completion, the vacancy rate is 15%, similar to the 14% vacancy rate for U.S. housing units.
- Today the market is soft, but it is far from the collapse that many are writing about. Full-year sales volume is likely to be down significantly year-over-year, compared to a rise of 18% last year, but listed developers are gaining market share and many are having a healthy year.
- Median new home prices are softening, but are still up year-over-year and are up strongly over the last eight years.
The Communist Party leadership does not seem too worried about property; they've taken only modest steps to support the market, and have yet to make the policy move that would really boost sales: eliminating the rules that require those seeking a home upgrade to put down 60% cash (vs. 30% for a first-time buyer) and pay a higher interest rate.
The boom days for the property market are over, but fundamental demand remains healthy. It is sensible to look closely at sales volumes, average selling prices and competitive pressures, but scary stories about bursting bubbles and ghost cities should be told around campfires, not investment committee meetings.
In the Beginning
The development of China’s commercial housing market is one of the world’s greatest and least recognized privatization success stories. In just 20 years, the country went from having one of the world’s lowest urban homeownership rates to one of the highest.
Back in 1958, 86% of urban workers were employed by state-owned enterprises (SOEs) and government departments, and that share remained above 70% through 1989. At that time, most workers lived in public housing, which was provided at minimal cost by their government work unit.
But between 1995 and 2001, the Communist Party laid off 46 million state-sector workers—equal to sacking about 30% of today’s U.S. labor force over six years! As a result, the state share of urban employment fell from 59% in 1995 to 28% in 2002. (As of last year, the state share was only 17%, with 83% of Chinese workers at private firms.)
The Party realized that it couldn't throw all of those laid-off workers out onto the street, so they allowed most of them—as well as most remaining SOE and government staff—to buy their government-provided flats at a steep discount to the market value (which was, at that point, very low). This was the largest one-time transfer of wealth in the history of the world, as most of China’s urban-housing stock was handed over to its occupants, and it helped create the liquidity to fuel China’s brand-new commercial-housing market.
Even Many Poor Chinese Are Homeowners
Almost all income groups appear to have benefited from the privatization of China’s housing market, according to an analysis of 2007 urban household survey data by researchers at Tsinghua University and the government’s planning agency. They found that while the rich were more likely to own their own home, even those in the lowest 10th percentile of income groups had a 73% homeownership rate. In contrast, in the U.S., the lowest 10th percentile of income groups had a 35% homeownership rate in 1997.
As a consequence of that transfer, the homeownership rate in China is now among the highest in the world: in 2011, 89% of urban residents owned their home, compared to 66% in the U.S.
But this high homeownership rate may not necessarily mean the appetite for new homes has been sated. First, because the 89% rate almost certainly does not include the one-third of the urban population (234 million people) that does not have an urban household registration, or hukou. Second, a large share of urban homes are sub-standard, so demand for upgrading is significant. For example, a 2010 survey found that 29% of urban residents still lived in the apartments they received from their work units, the majority of which were poorly built walk-ups. Many of those residents have to use shared toilet and kitchen facilities, and as of 2012, about 30% of households had a per capita living space of less than 20 square meters, or 215 square feet (the 2005 average per person in the U.S. was 916 square feet).
Most Buyers Are Owner-Occupiers, Not Speculators
One of the biggest misconceptions about China’s property market is that most buyers are speculators. In fact, the residential market is driven by owner-occupiers.
CLSA, the Hong Kong-based brokerage firm, collects data from sales managers at new residential projects across China each month, and reports that during the last three years, the share of buyers who were investors was only 7% to 12%, and that share has been below 20% since 2Q10. Government measures designed to curb speculative buying clearly had an impact.
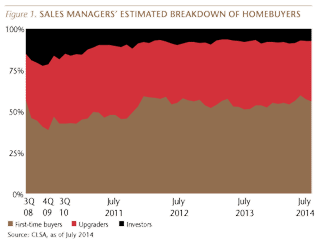
In July, 93% of new homebuyers were owner-occupiers, up from 79% in 1Q10. Of these, 56% were purchasing their first commercially-built home, while a further 37% were upgrading from another home they owned.
China Is Not Just Shanghai
Another common misunderstanding is the view that China is Shanghai and Beijing. But this is akin to assuming that the property markets in New York City and San Francisco are representative of the entire U.S. market.
This misunderstanding is why many people believe the China market is driven by speculation: many of us know someone in Shanghai who owns three apartments. In contrast, while many of us have friends in the US who own a vacation home, we understand that this does not represent the average American.
The four tier-one cities of Beijing, Shanghai, Guangzhou and Shenzhen last year accounted for only 10% of China’s urban population and 5% of total residential property sales (by floor space). There are more than 150 other Chinese cities with a population of at least 1 million, and they account for the vast majority of the nation’s property sales. (Recall that the U.S. has only nine cities of over 1 million people.)
Last year, for example, new residential sales in Hefei (the capital of Anhui Province) were greater, by volume, than sales in Beijing. Sales in Chengdu (the capital of Sichuan Province) were greater than sales in Shanghai. And in all of the tier-two cities, which account for 30% of national sales, average prices were 58% below average prices in tier-one cities in 2013. Prices in smaller tier-three cities, which account for 65% of total sales (and 58% of the urban population), were 73% below tier-one prices.

Prices Rising In Line With Income
From an American or European perspective, China’s 9% average annual growth in residential property prices may appear to be the hallmark of a bubble. But this assessment would fail to put that data point into the context of similarly rapid income growth—a rise in wealth that may be difficult for residents of developed countries to comprehend.
With average annual nominal urban income growth of 13% over the past eight years, the 9% average annual appreciation in new home prices is far less worrying.
Unprecedented income growth not only supports China’s remarkable consumption story, it also underpins a healthy property market. Over the past decade, inflation-adjusted urban income rose by 7% or more every year, while real rural income increased by 7% or more during each of the past eight years. In contrast, over the past decade real income rose at an average annual pace of 1% in the U.S. and 0.3% in the U.K.
Homeowner Leverage Is Exceptionally Low
In my view, an important precondition for a bubble in any asset class is a high level of leverage, because in the absence of high leverage, the consequences of a sharp price decline are limited. In China, there is extremely low leverage among homebuyers because about 15% of buyers over the past three years paid all cash, while for those using mortgages a minimum cash down payment of 30% is required.
Buyers who use mortgages have a lot of skin in the game. The minimum cash down payment is 30% for owner-occupiers and 60% for investors and most upgraders.
Chinese banks have not been permitted to offer subprime mortgages, option adjusted-rate mortgages and other loans that allow borrowers to defer interest or principal payments. Home-equity loans are rare, so Chinese cannot use their house as an ATM. And because Chinese banks still generally follow the traditional model of holding loans until they are repaid, there is very little securitization.
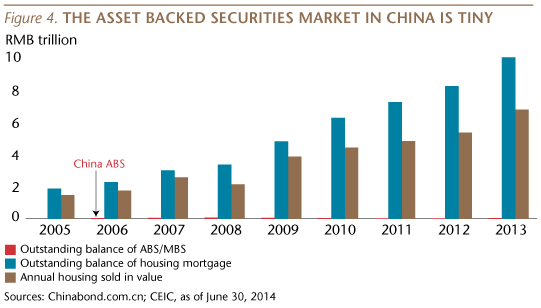
Additionally, unlike in the U.S., there are few asset-backed securities (ABS) in China, and almost no secondary securitization (such as collateralized debt and collateralized loan obligations that created havoc in the U.S. system).
Even with a jump in new issuances, the outstanding balance of asset-backed securities (ABS) in China is so small that the red bar on the following chart is barely visible.
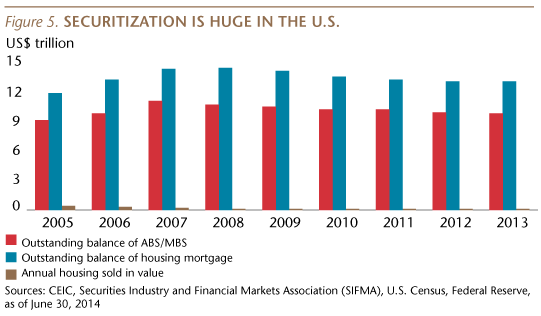
Quite a difference from the scale of ABS outstanding in the U.S.
Mortgages/GDP Ratio Low
The use of mortgages by homebuyers has been increasing as they have become more readily available, especially in central and western China, but mortgages remain a very small part of China’s financial system. The ratio of residential mortgage loans to GDP is only 18%, compared with the U.S. peak of 83% in 2007.
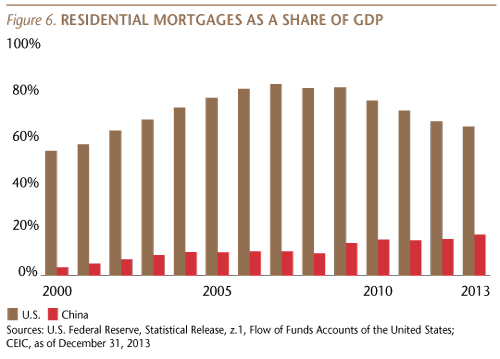
A recent CLSA study of middle-class families found that although 99% owned their home, only 30% had a mortgage.
Affordability is a Social Problem
Based on average income for Beijing, no one in the city can afford to buy a new home. While true, that data point is as helpful as stating that based on average income for London, no one there can afford to buy a house, or that based on average global income, Porsche should not be able to sell a single car.
The housing markets in Beijing and London are not targeted at average income groups. This creates social and political problems in both locations, but is not evidence of a housing bubble.
In China, the market for commercially built urban homes, which has been in existence for just over a decade, is focused primarily on the middle class and wealthy, who are a relatively small share of the nation’s population but number in the hundreds of millions of individuals. Some of the data we have cited earlier in this report—notably that about 15% of recent first-time homebuyers paid all cash, and that the minimum cash down payment for those using a mortgage is 30%—reflect that for the target population, housing is affordable. And, as we noted earlier, 65% of new home sales take place in tier-three cities that most of us have never heard of, and where prices are 73% below those in the tier-one cities such as Shanghai and Beijing.
The fact that the average residents of the largest Chinese cities, like the average residents of most major cities around the world, cannot afford to buy a downtown home does represent a significant social problem, which is why the Party has embarked on a major program to build low-income housing.
Low-Income Housing
The push to build social (low-income) housing in China began under the previous Party leadership, but has re-accelerated under the current regime run by Xi Jinping and Li Keqiang, mitigating, to a limited extent, the impact of cooling activity in commercial housing.
Providing blue-collar workers—who are largely priced out of the commercial housing market—with better living conditions is a political priority for the one-party regime. This spending also eases the pain resulting from slower growth in commercial residential construction, which is an important source of jobs.
Activity has re-accelerated this year. Social housing starts—the majority of which are actually reconstruction of existing low-income housing, which the government refers to as “shanty towns”—in the first seven months of this year are up 18% year-over-year (but up only 2% for the same period in 2012), while completions are up 21% (-6% on 2012).
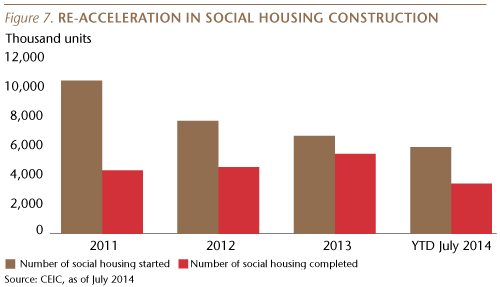
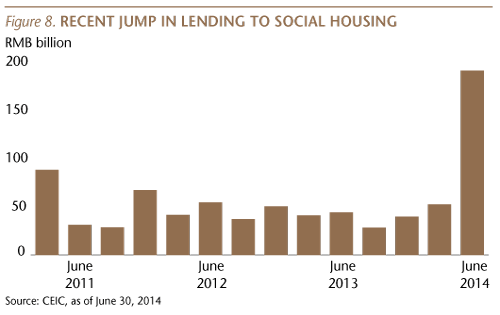
This re-acceleration is likely to continue, as the Party is encouraging banks—including the main policy lender, the China Development Bank—to increase lending to local governments to fund social housing construction. Bank loans for social housing jumped by more than three-fold year-over-year during 1H14.
Ghost Cities
One of the most frightening stories about China’s property market is that the country is full of “ghost cities” of empty apartment buildings and tumbleweed, with Lon Chaney, Jr. lurking around the corner. These stories are widely believed, but are plagued by the absence of hard data and a misunderstanding of the Chinese market.
The “ghost city” reports we’ve read are usually based on observations along the lines of, “we drove past buildings that appeared to be completed yet unoccupied.” This is problematic, unless those analysts have x-ray glasses that are far better than the pair I bought as a kid from Boy’s Life magazine.
Below is a photo of a new project I visited recently in the city of Changzhou, in Jiangsu Province. Changzhou’s urban population is 3.2 million, which is larger than Chicago. This complex appears ghostly, and none of the apartments were occupied, although about 40% of them have been sold. But a conversation with the sales manager and then a tour of the project revealed that this was because interior construction was still underway and none of the apartments had been turned over to the buyers. Without going inside, however, it would be easy to mistake this for a ghost city.
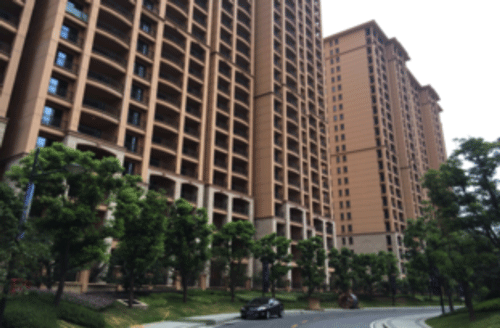
It is important to understand how China’s property market differs from that of the U.S. and other developed countries. For example, about 80% of new apartments are sold on a pre-sale basis, which means the contract is signed from one to two years before the building will be completed. And about 80% of new apartments are sold unfinished, which means the owner takes possession of a bare concrete shell, which looks something like this:
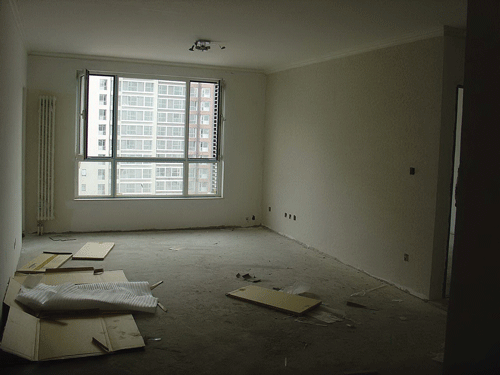
Finishing the apartment—everything from floors to kitchens and bathrooms—can take another three to six months after the new owner takes possession, and many people wait to move in until most other owners have finished their decorating, to avoid living in the midst of a construction site.
Another unique factor is that most new apartments are being built outside of city centers, because the traditional downtown area is too congested and land is either unavailable or too expensive. The government is encouraging developers to focus on new areas away from downtown by planning
infrastructure, everything from subways to light rail and hospitals and schools. But these projects take time to complete.
In the new district of the city of Zhengzhou, for example, many apartment buildings were completed several years ahead of the opening of the subway line to the area. Zhengzhou, with an urban population of 6 million (about the size of the Washington, DC-Arlington, Virginia Metro Area), started construction in 2009 of subway system planned for six lines covering a total of 125 miles, and the first line opened in late 2013. Many people in Zhengzhou decided to buy apartments in the new area with the intention of not moving in for several years, based on the view that housing prices would rise after the subway lines were completed. In the meantime, parts of the new district do look ghostly.
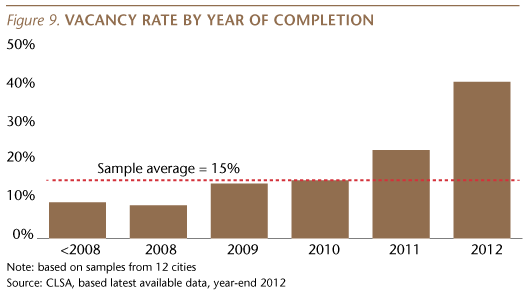
The one detailed study of ghost cities we’ve read was published in May by CLSA, based on a study of 609 residential projects in 12 cities, covering over 800,000 apartments. CLSA’s conclusion was that “tracking vacancy by year of completion suggests a portion of the vacancy is a timing issue, and vacancy seems to normalize after the first three years of completion. The vacancy rate in our sample drops from 40% in the first year of completion, to 23% in second year, to 15% in the third year.” (CLSA defines vacancy as “completed but unoccupied, regardless of whether the property has been sold.”) For projects completed during the 2007–08 period, the vacancy rate was only 9%.
These vacancy rates of 15% after three years and 9% after five years are similar to the 14% vacancy rate for U.S. housing units, according to Census data for 2Q14.
The Current State of the Market
China’s residential property market has been soft this year, but it is far from the collapse that many are writing about. Full-year sales volume is likely to be down 7% to 9% year-over-year, compared to a rise of 17.5% last year, but listed developers are gaining market share and many are having a healthy year. Median new home prices are softening, but are still up year-over-year and are up strongly over the last eight years. The Party leadership does not seem too worried about the property market; they’ve taken only modest steps to support the market, and have yet to make the policy move that would really boost sales: removing the mortgage penalty now applied to upgraders. Developers have been cutting new home prices, but on a scale that suggests they are not panicking.
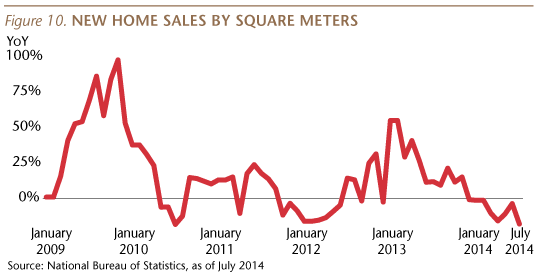
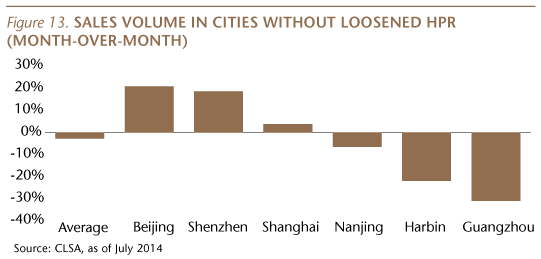
Year-to-date sales volume slowed further in July and is down 9% year-over-year. Residential floor space sold was down 17.9% year-over-year in July, compared to -3.5% year-over-year in June and +12% a year ago. On a month-over-month basis, sales volumes fell 32.6% in July, one of the worst months ever. Sales have been down year-over-year for eight consecutive months, similar to nine straight months of falling sales in late 2011/early 2012. Year-to-date sales are down 9.4% year-over-year, compared to a rise of 27.1% during the first seven months of last year. If the current trends continue, full-year sales may be down 7% to 9%, compared to a rise of 17.5% for all of 2013.
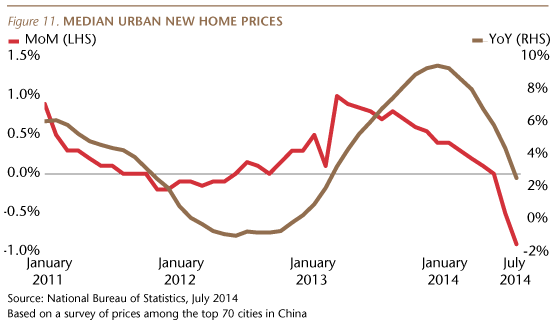
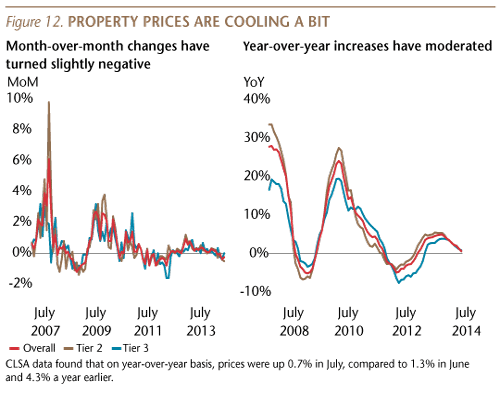
Median new home prices are softening but are still up year-over-year. According to the National Bureau of Statistics’ 70 city survey, median new home prices rose 2.6% year-over-year in July, compared to 4.4% in June and 6.8% a year ago. On a month-over-month basis, median prices in these cities fell 0.9% in July and declined 0.5% in June, the first time prices fell month-over-month since May 2012, which was the end of seven consecutive months of falling month-over-month prices.
Assuming that month-over-month prices continue to decline in the coming months, this data set is likely to record falling year-over-year prices in the near future. But keep in mind that national new home prices (a different data set) rose at an average annual pace of 9.3% over the past eight years, so only a tiny share of homeowners will be in the red—and given the minimum cash down payment of 30%, almost none should be underwater on their mortgage.
CLSA’s data for Tier 2 & 3 cities (where the majority of sales take place) reports similar trends. Data for the 120 projects in 40 cities monitored independently by CLSA found month-over-month prices fell 0.3% in July, after falls of 0.4% in June and 0.1% in May and April (and compared to +0.2% a year ago).
The Communist Party leadership does not seem too worried about the property market; they've taken only modest steps to support the market. The house purchase restriction (HPR), which limits the number of homes a family can own, and prevents most people who have recently moved to a city from buying there, has been eliminated in 20 cities and relaxed in 14 cities. When CLSA examined data for July in 12 of those cities, they found that sales volume rose by an average of 15% month-over-month where the HPR was removed or relaxed, but fell 3% month-over-month in cities where the HPR was not adjusted. (The HPR remains fully in force in 14 cities, including Beijing, Shanghai, Shenzhen and Guangzhou, the four tier-one cities.)

The Party has yet to make the policy move that would really boost the market: changing the mortgage rules which were put in place four years ago to cool down a hot market. Those rules require an “upgrader”—someone who owns a home but plans to sell it and pay off his mortgage, and then buy and live in a nicer home—to put down 60% cash (vs. 30% for a first-time buyer) and pay a higher interest rate. These rules could be relaxed to treat upgraders and first-time buyers similarly, without raising financial risks. There are rumors that such changes are coming, but we’ve seen nothing to suggest this from officials for the near term. This discrimination against upgraders, who account for 37% of buyers in tier-two and tier-three cities, will eventually be ended—there is no prudential basis for it—and that should deliver a significant potential boost to the market.
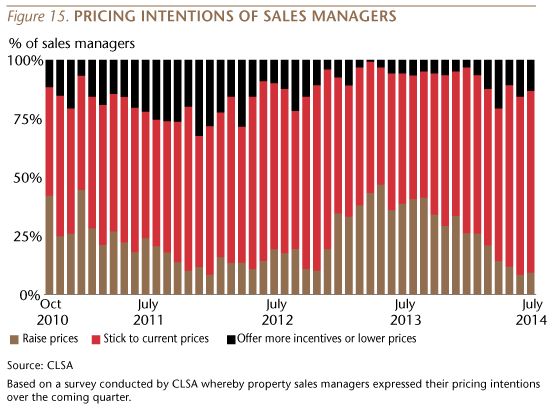
Developers have been cutting new home prices, but on a scale that suggests they are not panicking. Thirteen percent of sales managers told CLSA they cut asking prices in July, down from 16% in June but up from only 6% a year ago.
What’s Next?
In past editions of Sinology, we’ve noted that it is inevitable that China will, on average, grow a bit more slowly every year for the foreseeable future. This applies to the residential property market as well. This is a natural consequence of a maturing market, changing demographic trends and the base effect.
But, slower growth—or even declining year-over-year changes—may not signal impending doom.
Fundamental demand for housing appears healthy. There are about 13 million marriages every year in China, and new couples account for about one-third of new home sales. There are about 13 million births a year and the urban population increases by about 21 million annually. Inflation-adjusted urban income rose by 7% or more every year over the past decade (including in 1H14), and household savings increased by 340% over the last 10 years to more than US$8 trillion, greater than the combined GDPs of Russia, Brazil and India.
Ongoing relaxation of the house purchase restriction (HPR) is opening up the market to more qualified buyers, and the eventual lifting of rules that discriminate against upgraders could provide the opportunity for an even bigger boost.
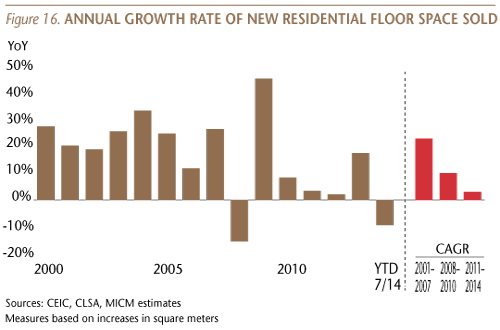
The boom days of China’s property market are, however, over. The peak in new home sales is approaching, and it is highly unlikely that prices will continue to rise at an average pace of 9%. But even if sales volume declines by 9% this year, that still leaves sales of about 10 million new urban apartments in a country where, according to Morgan Stanley, the 10 biggest residential developers have now raised their share of the market to 18% from less than 14% a year ago. Sales revenue at China’s biggest residential developer rose 21% year-over-year in 1H14 and their net profits increased by almost 6%.
It is sensible to look closely at sales volumes and average selling prices and competitive pressures, but scary stories about bursting bubbles and ghost cities should be told around campfires, not investment committee meetings.
Andy Rothman
Investment Strategist
Matthews Asia
